Venngage is a design tool that helps you create accessible infographics, reports, and presentations. It includes built-in features such as contrast checkers and tools for adding alt text that make it easier to ensure your digital materials are accessible. Compared to similar tools such as Canva, Venngage offers more accessibility features, interactive elements, and fully compliant PDF exports, making it ideal for professional and inclusive design workflows. If you are familiar with Canva, be sure to review the Venngage vs. Canva comparative guide.
- Getting Started with Venngage
- Venngage Best Practices
- Venngage Accessibility Checker
- Venngage vs. Canva
- External Resources
Getting Started with Venngage
The Venngage documentation on getting started includes useful information on account setup and creating your first design, along with tailored content depending on your role. This section will guide you through the process of creating with Venngage, whether you are building from scratch or using an existing layout.
Additionally, there are three primary ways to create an infographic with Venngage:
- Manual creation
- Using a template
- Using AI
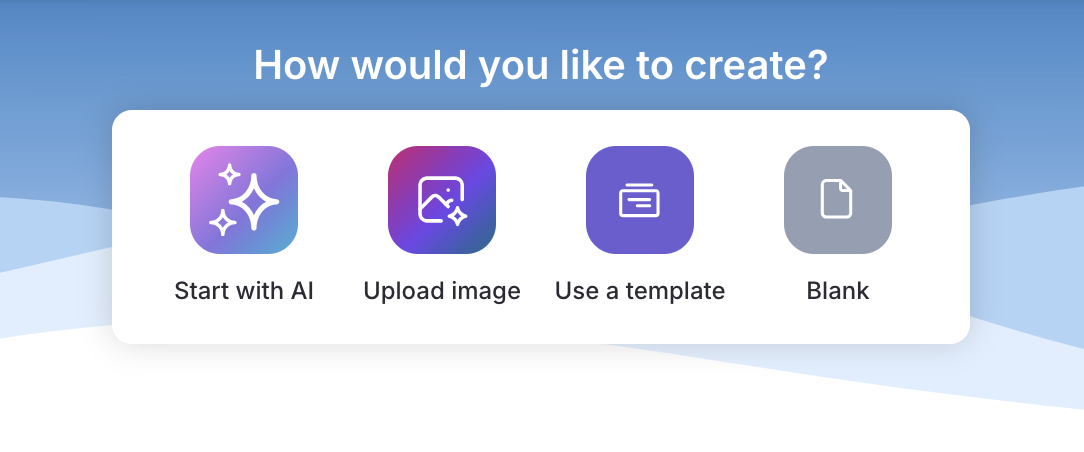
Navigate to the Venngage homepage (Home > My Designs) and select your creation method from the top, where you can opt to create your infographic via any of the three ways described above.
Creating an Infographic Manually
- Select “Blank” from the creation menu
- Select your image dimensions, then click “Create” to be brought to the design editor
Creating an Infographic Using a Template
- Select “Use a template” from the creation menu
- Browse categories in the left sidebar or search with keywords (e.g., “to-do list”). Venngage provides a guide with tips on how to find the perfect template.
- Hover a template to preview, then click “Create” to open it in the editor.
- Click “Start Editing” to customize the template.
Creating an Infographic Using AI
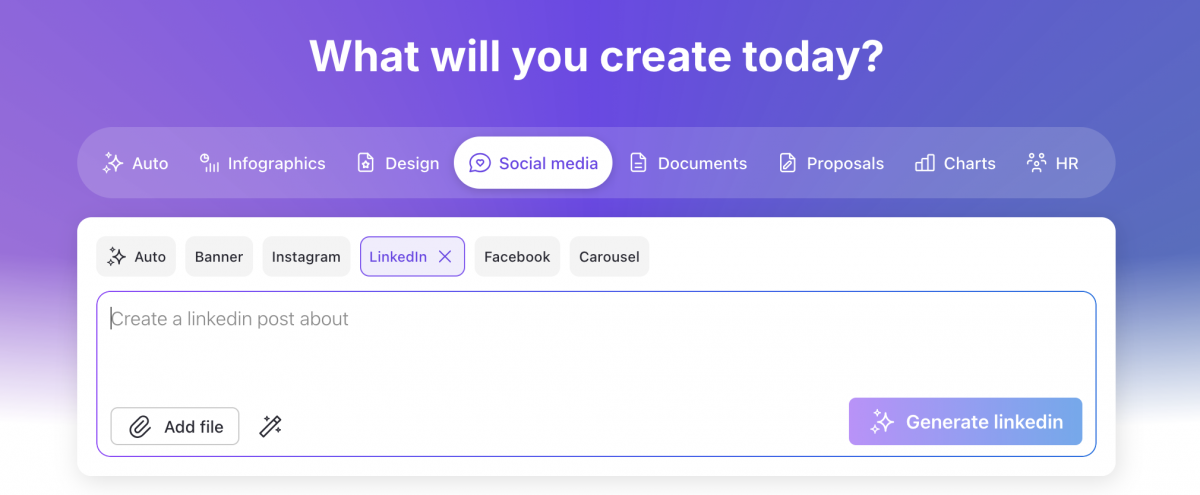
- Select “Use a template” from the creation menu or navigate to DesignAI in the topnav.
- You will be able to input your text prompt on what you want to create. You can remain on “Auto” mode or select a specific type of infographic, such as a LinkedIn post
- For more on using Venngage’s AI tool DesignAI, check out the documentation on the DesignAI Universal Generator.
- For details on how to leverage DesignAI and optimize your text prompts, check out the Venngage’s documentation on effective prompting for design.
Venngage Best Practices
The following section will consist of Venngage best practices and recommendations with accessibility in mind.
Document Title and Language
Document Title
Document titles and page titles help accessibility and assistive technology users understand what a document is about without needing to read the entire content. Titles should be both clear and descriptive. Venngage’s documentation provides an overview on how to title your design with accessibility in mind.
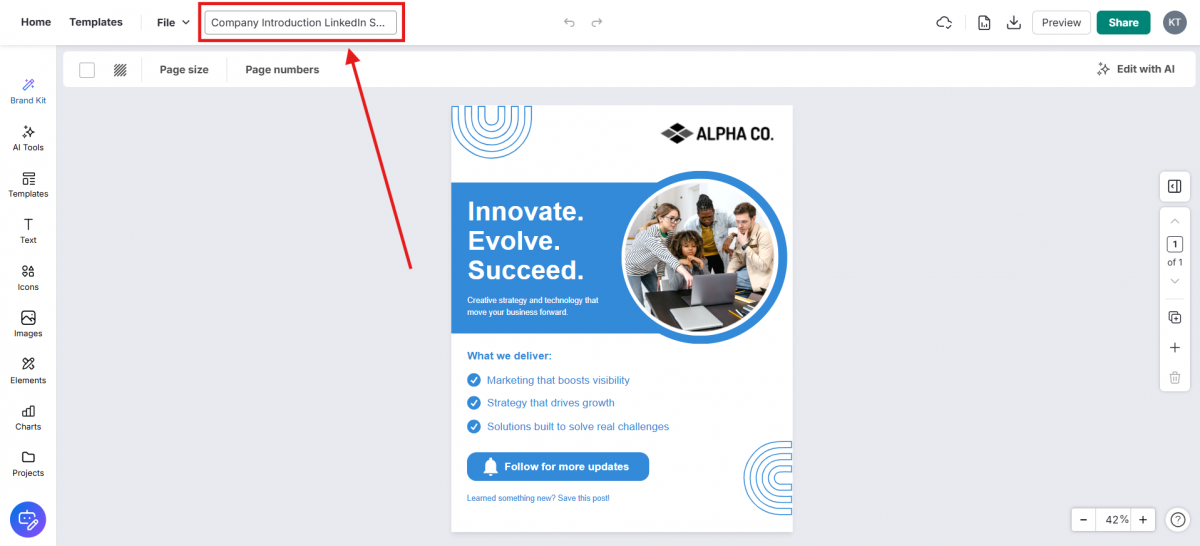
To edit your document title, simply update the Title field at the top of the Editor.
Document Language
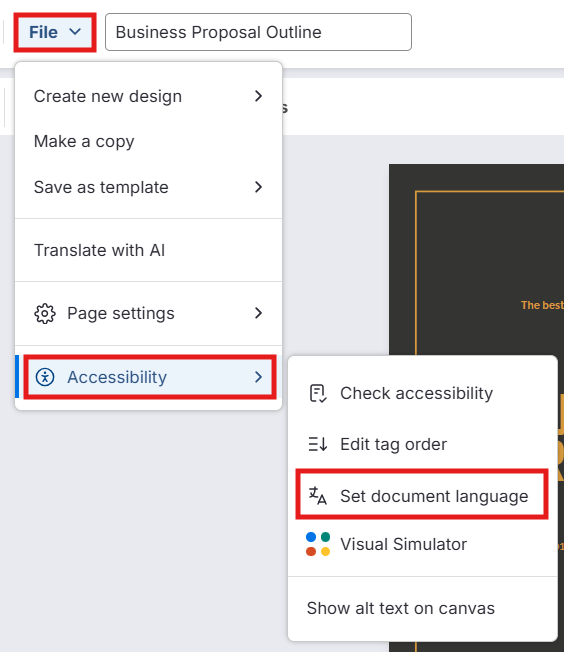
Venngage also outlines how you can set your document language. This is crucial for screenreaders and other accessibility tools.
To set the document language:
- Navigate to File > Accessibility > Set Document Language
Document Text
Headings and Text Tag Hierarchy
Headings guide readers by creating an overview of the structure of a document, marking different sections and subsections, and highlighting their content. Readers use these markers to navigate long or content-dense documents more easily and to determine what to expect in that section.
In Venngage, you can set heading levels from H1-H6, along with a Paragraph option for the text body.
To access the headings/text tag hierarchy section:
- Click the Tag icon on the far right of the top of the toolbar
- Choose the appropriate text tag (H1-H6 or Paragraph)
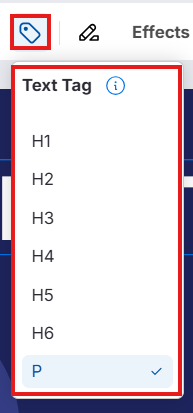
Check out Venngage’s documentation on accessible headings and titles and Venngage’s documentation on tag order for more details.
Text Size
Fonts play a huge role in setting the tone and readability of your design. Venngage support has a list of articles on adding and editing text, and working with fonts.
To change the text size in Venngage:
- Select the text box
- In the top toolbar, open the Text Size widget to adjust:
- Use the plus (+) or minus (–) buttons for small changes.
- Or click the number field to type or select a new size.
You can also resize the text box itself to control how text wraps or fits:
- Click and drag the bounding box handles, or
- Use CTRL (Windows) / CMD (Mac) + arrow keys to resize by 1px.
- Hold SHIFT while doing this to resize by 10px at a time.
Links
Accessible links help all readers, including those using screen readers or assistive technology, navigate your content with ease.
To add a link to text in Venngage:
- Select the word or section of text that you want to hyperlink.
- Click the link icon in the top toolbar. It’s located between the Bulleted List and Text Tag icons.
- Enter the URL or web address in the field provided, then click OK to apply the link.
For more on accessible links with Venngage, visit the Venngage documentation on adding accessible links.
Color
Contrast and color play an important part in whether your design will meet accessibility standards. Viewers with visual impairments or disabilities should be able to see and understand your infographics.
Your colors should:
- Provide enough contrast so all text and visuals remain visible.
- Complement each other naturally.
- Tell a clear visual story that supports your content or data.
For additional resources on color, see Venngage’s documentation on using color contrast for accessibility and conveying meaning without color.
Images
When adding images to your Venngage graphics, be sure to include alt text. Alternative (alt) text is a descriptive text that identifies non-text content for visually impaired readers and is recognized by accessibility tools like screen readers. Use alt text to describe informative and decorative elements in your accessible images. You should also be using alt text for other elements, such as icons, shapes, photos, or charts.
Use the Alt Text Tool in the Venngage Editor
- Select any non-text element on your design canvas — such as an icon, shape, photo, or chart.
- Click “Alt Text” in the top toolbar or press the spacebar (for keyboard users).
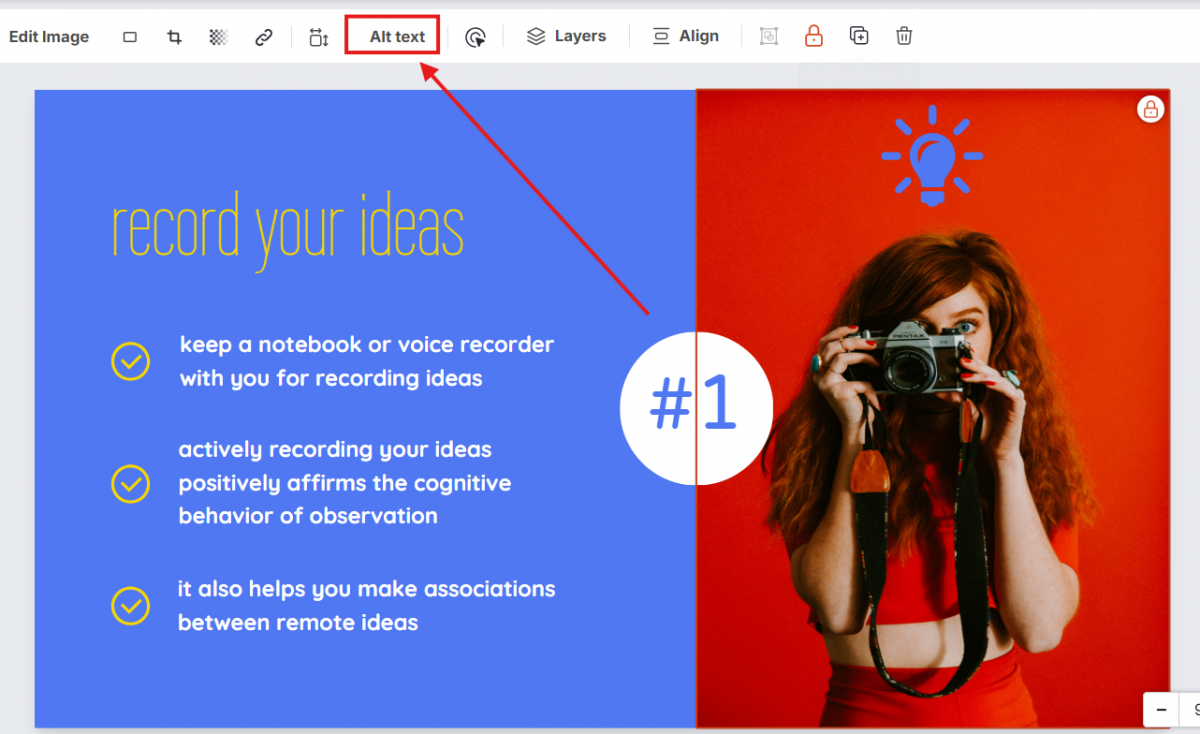
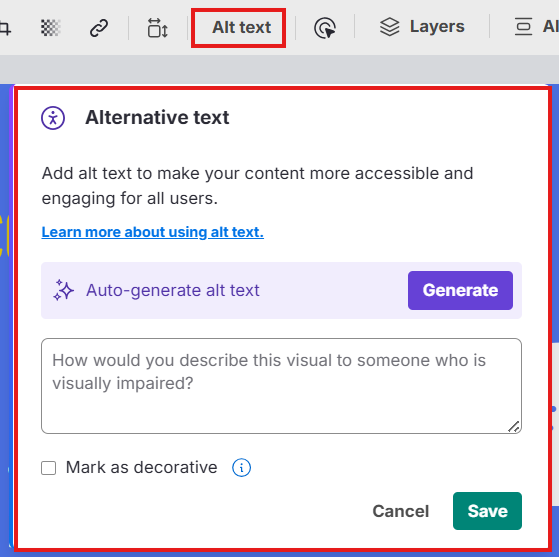
- Choose whether the element is decorative or add a description for screen reader users.
- Click Save when you’re done. You can edit or update the text anytime before downloading or sharing your design.
Additionally, the following are relevant Venngage resources on images:
- How to Tag and Add Alt Text to Elements in Design
- How to Write Helpful Alt Text
- Using “Text” Instead of “Images of Text”
Venngage Accessibility Checker
Venngage provides multiple tools to check the accessibility of your infographics. For a high-level overview, visit Venngage’s support documentation on the tools you can use to check accessibility.
Accessibility Checker
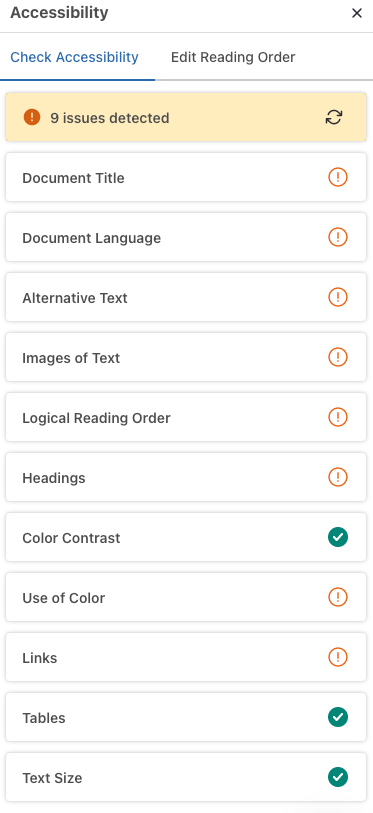
Within your designs, you can access Venngage’s accessibility checker to ensure there aren’t any accessibility barriers in your infographics/content. The accessibility checker scans your design for potential barriers across the following categories:
- Document Title
- Document Language
- Alternative Text
- Images of Text
- Logical Reading Order
- Headings
- Color Contrast
- Use of Color
- Links
- Tables
- Text Size
Getting Started with the Accessibility Checker
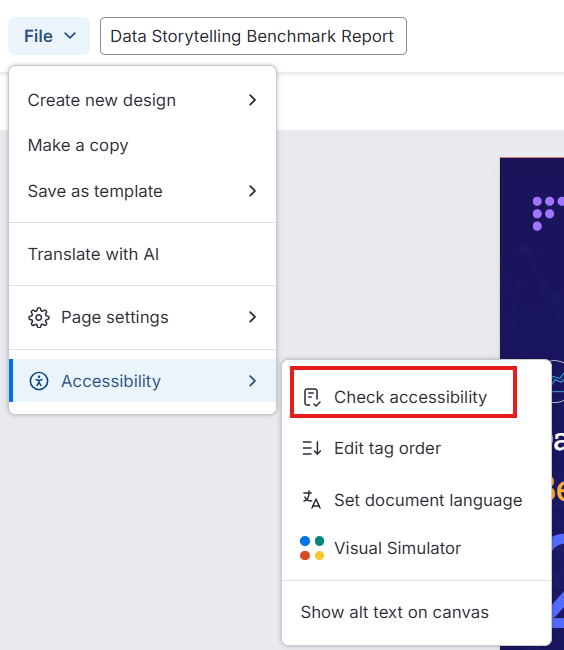
To open the accessibility checker:
- Open your infographic/content in the design view
- Click File in the top toolbar.
- Select Accessibility from the dropdown menu.
- The Accessibility Checker panel will open on the right side of the editor.
- To learn more about specific changes/recommendations, visit Venngage’s support documentation on the accessibility checker.
How Issues are Highlighted
Each issue is marked as either needs review or passing. If you would like to learn more about each issue, you can click to expand for an overview/explanation.
- Categories flagged for review show an orange exclamation mark.
- Categories that pass the check display a green checkmark.
- You can click each category to expand it and view detailed guidance on what needs attention.
Reviewing/Editing Your Design
- Review the flagged elements in your design.
- Make adjustments directly in the editor (e.g., update alt text, adjust color contrast, reorder elements).
- Check off items under each category as you address them to track your progress.
Tip: Use the Accessibility Checker throughout your design process to ensure your document is inclusive and compliant.
Color Contrast Checker
The Color Contrast ratio helps ensure that people with visual impairments or other disabilities can easily see and interpret elements in your design. Venngage’s color contrast checker evaluates your design elements against WCAG (Web Content Accessibility Guidelines) to help you create more accessible and inclusive visuals.
Using the Color Contrast Checker
To check an element’s contrast, make sure it’s selected on your design canvas. Then:
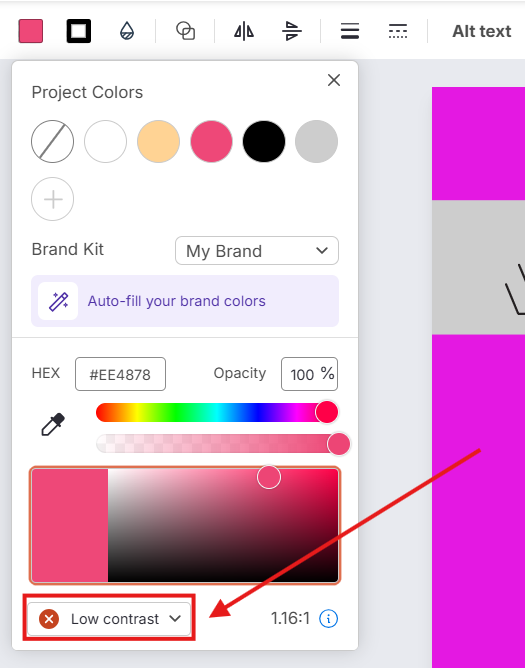
- Click the Color menu in the top toolbar.
- At the bottom of the color panel, look for the Contrast Ratio section. This shows how the element’s color compares to its background.
- A red “x” appears if the contrast ratio does not meet accessibility standards.
- A green checkmark appears if it does meet the required ratio.
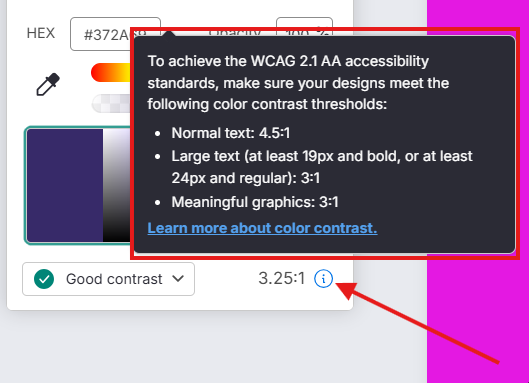
- You can also Click the info icon next to Contrast Ratio for more details about WCAG contrast requirements.
Adjusting the Color Contrast Ratio of an Element
If your element’s color doesn’t meet accessibility standards:
- Use the color picker or enter a new HEX code in the color menu.
- The Contrast Ratio value and checker will update automatically as you adjust the color.
Visual Impairment Simulator
Venngage’s Editor also includes a Visual Simulator tool that lets you preview how your design appears to people with different vision conditions. For more information on the Color Blindness Simulation Tool, visit Venngage’s official support documentation.
Opening the Visual Impairment Simulator
To access the Visual Impairment Simulator, there are two options:
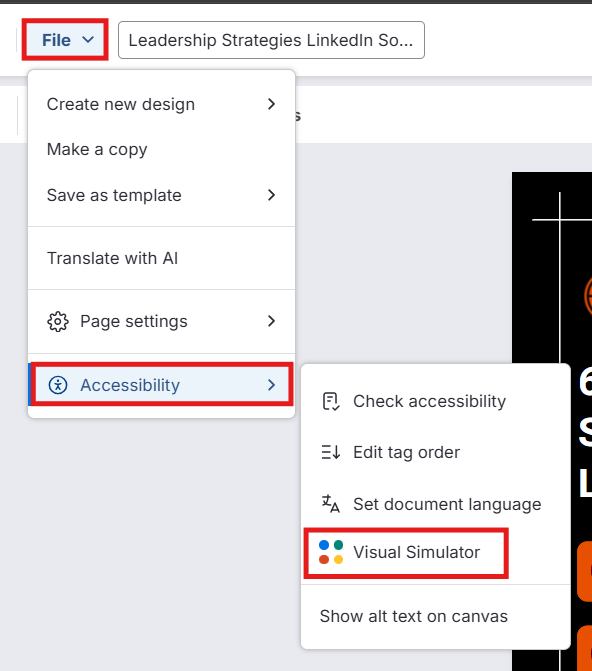
- Navigate to File > Accessibility > Visual Simulator
- Navigate to File > Accessibility > Check Accessibility to open the accessibility checker
- Then select “Simulator” from the far right on the panel that appears
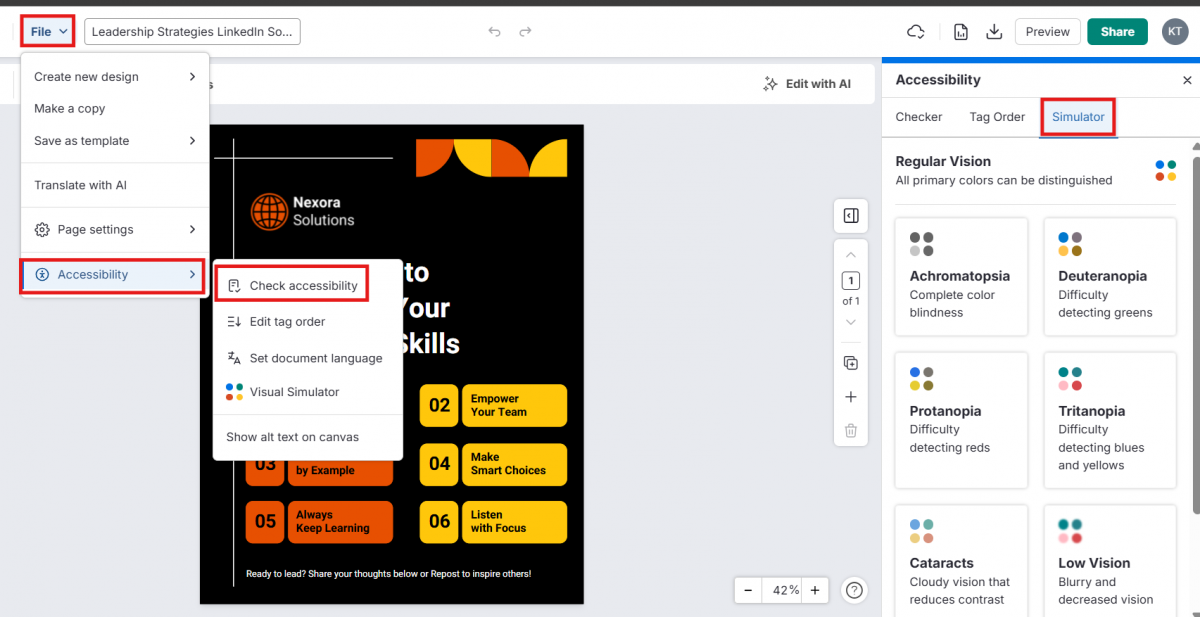
Choosing What to Simulate
You can then select one of the options to see how your design appears under different visual conditions:
Venngage vs. Canva
This section provides a detailed comparison of Canva, and Venngage, focusing on design features, accessibility, AI tools, and PDF export capabilities to help users select the best platform for their creative and professional needs.
Design Features
| Category | Canva | Venngage |
|---|---|---|
| Templates | Hosted in ‘Design’ tab with layout and style options; AI-assisted template creation | Search and filter by plan type, page size, layout, accessibility, and interactivity |
| Branding | Brand Kits, Brand Templates, and Brand Controls for consistent identity | Add logos, icons, colors, and fonts to Brand Kits; font sizes limited to dropdown options |
| Elements | Includes shapes, graphics, photos, videos, 3D, forms, stickers, audio, charts, tables, mockups | Offers interactive elements like GIFs, QR codes, quizzes, labels, forms |
| Text Tools | Quick actions for headings, body text, AI writing, font combinations | Add text blocks/lists from Elements; heading and paragraph buttons |
| Uploads | Upload files, record audio/video, organize in folders | Upload files, organize with folders, access expansive stock image library |
| Charts & Maps | Wide variety including bar, pie, scatter, radar, funnel, hierarchy, etc. | Includes tables, charts, graphs, pyramids, tree maps, word clouds, 250+ map templates, etc. |
| Projects | Filter by ownership; tabs for Designs and Folders | Shows all files with search functionality |
Accessibility Features
| Feature | Canva | Venngage |
|---|---|---|
| Color Contrast | Detects contrast issues; suggests alternative text colors | Contrast indicator with ratio display |
| Alt Text | Available for all elements; manual decorative marking | Only for image-based elements; icons auto-marked as decorative |
| Headings | Text Styles tab with generic styles; size indicates style | Text Tag toolbar option syncs with Text Styles for heading levels 1–6; size not used as indicator |
| Typography | Alerts for small text; recommends 12pt minimum | Regular text sizing |
| Reading Order | Uses layer order; difficult to visualize | Editable Tag Order with preview of screen reader flow |
| Translations | Supports 130+ languages; individual element translation | Supports 130+ languages; full-document translation only |
AI Capabilities
| Feature | Canva | Venngage |
|---|---|---|
| AI Tools | Magic Media (Images, Graphics, Videos, 3D), AI Designer, Feedback, Translate Text | DesignAI infographic generator (Infographics, Design, Social Media, Documents, Proposals, Charts, HR) |
PDF Export & Compliance
| Feature | Canva | Venngage |
|---|---|---|
| PDF Accessibility | Not compliant; errors in structure tree and tagging | Fully compliant with PDF, PDF/UA, and WCAG standards |
| Table Tagging | Manual tagging required; often problematic | Automatically tagged and structurally sound in Adobe Acrobat Pro |
| Export Quality | Templates exported as PDFs are not accessible | Templates exported as PDFs are 100% accessible |
In summary, Canva excels in design flexibility, AI tools, and app integrations, but falls short in accessibility and PDF compliance. Venngage offers robust accessibility features, interactive elements, and fully compliant PDF exports, making it ideal for professional and inclusive design workflows.